Raw Data
CityPy library and OpenWeatherMap API were utilized to generate retrieve random list of cites, associated weather data and create a representative model of weather across world cities.
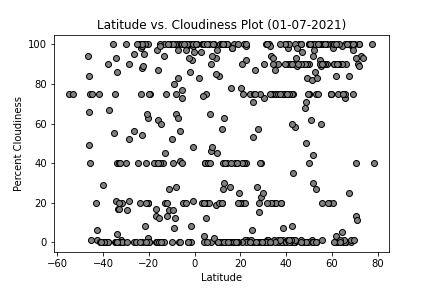
Check out the DataLatitude vs. Cloudiness (%) scatter plot does not appear to show a strong correlation.
Latitude vs. Cloudiness (%) scatter plot shows data points evenly dispursed across all latitudes. Many data points concentrated at 100%, 0%, but evenly across all latitudes. Slightly more data points above the equator (greater than zero degrees latitue). The plot shows very weak to no correlation between latitude and percent cloudiness.
CityPy library and OpenWeatherMap API were utilized to generate retrieve random list of cites, associated weather data and create a representative model of weather across world cities.
Check out the Data