Raw Data
CityPy library and OpenWeatherMap API were utilized to generate retrieve random list of cites, associated weather data and create a representative model of weather across world cities.
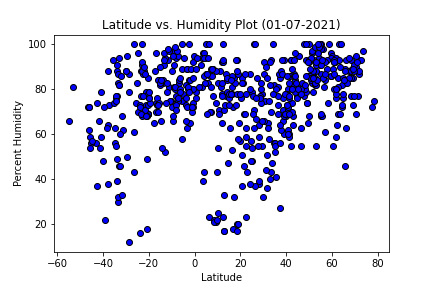
Check out the DataLatitude vs. Humidity (%) scatter plot does not appear to show a strong correlation.
Latitude vs. Humidity scatter plot shows most data points at 60% humidity or higher across all latitudes. There are more data points north of the equator (greater than zero degrees latitude), but the plot does not show a strong correlation between percent humidity and latitude.

CityPy library and OpenWeatherMap API were utilized to generate retrieve random list of cites, associated weather data and create a representative model of weather across world cities.
Check out the Data