Raw Data
CityPy library and OpenWeatherMap API were utilized to generate retrieve random list of cites, associated weather data and create a representative model of weather across world cities.
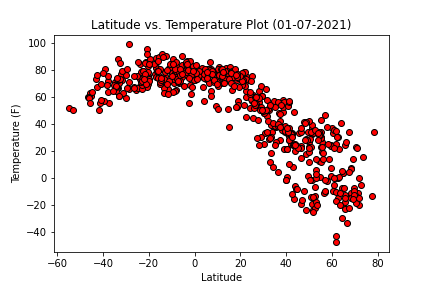
Check out the DataLatitude vs. Temperature (F) scatter plot shows temperatures rising as you get closer to zero degrees latitude.
Latitude vs. Temperature (F) scatter plot shows temperatures rising as you get closer to zero degrees latitude (equator), then as the latitude values increase greater than zero (increasing further from the equator), the temperature decreases steadily.
CityPy library and OpenWeatherMap API were utilized to generate retrieve random list of cites, associated weather data and create a representative model of weather across world cities.
Check out the Data